

In the first Matrix movie Agent Smith is holding Neo down on the subway tracks as a train approaches and says: “You hear that, Mr. Anderson? … That is the sound of inevitability…”
Demography has that flavor. Over the medium run (10 to 30 years) demography is perhaps the most predictable part of our future. After all, if you want to know how many people thirty year olds there will be in the economically distant future of 2056, just count babies today (with some modest adjustments).
Ageing: The Real Demographic Challenge
The primary phenomena that all rich industrial countries will experience over the next 30 years is not “de-population” – that is coming (see Geruso and Spears, here and here) just later – but ageing. Over the coming years the population of the labor force aged will fall absolutely and the population of those over 65 will rise by about the same amount. This means that the total population will stay about the same, but will be much older.
I have written papers that document the implications of that for the future of the ratio of the labor force aged to 65 plus (many of whom are also in the labor force) for the rich industrial countries using the standard global sources for population projections, with an emphasis on the “zero migration” scenarios (here and here).
What the Congressional Budget Office Data Shows
In this post I use the recent (January 2026) projections of the US population done by the Congressional Budget Office (CBO) to document these trends for the USA. While in previous papers I used global data to have comparability, here I use an official US source to focus on just the USA. A strength of the CBO data is that they have detailed projections of migration by age which allows the calculations of a “zero migration” scenario for specific age groups.
I use the CBO projections of the “Social Security” population of the USA and then use their data on the immigration and emigration to calculate the net immigration by age groups 0-19, 20 to 64, and 65 plus. I deduct the cumulated net immigration from the CBO projections to estimate the evolution of the labor force aged and 65 plus populations of the USA under the scenario of zero net immigration after 2026.
The Zero Net Immigration Scenario
Figure 1: In a scenario of zero net immigration the labor force (LF) aged (20-64) population of the USA falls by 20.5 million and the 65 plus population rises 21.9 million. The ratio of labor force aged to 65 plus falls from 3.1 to 2.1.
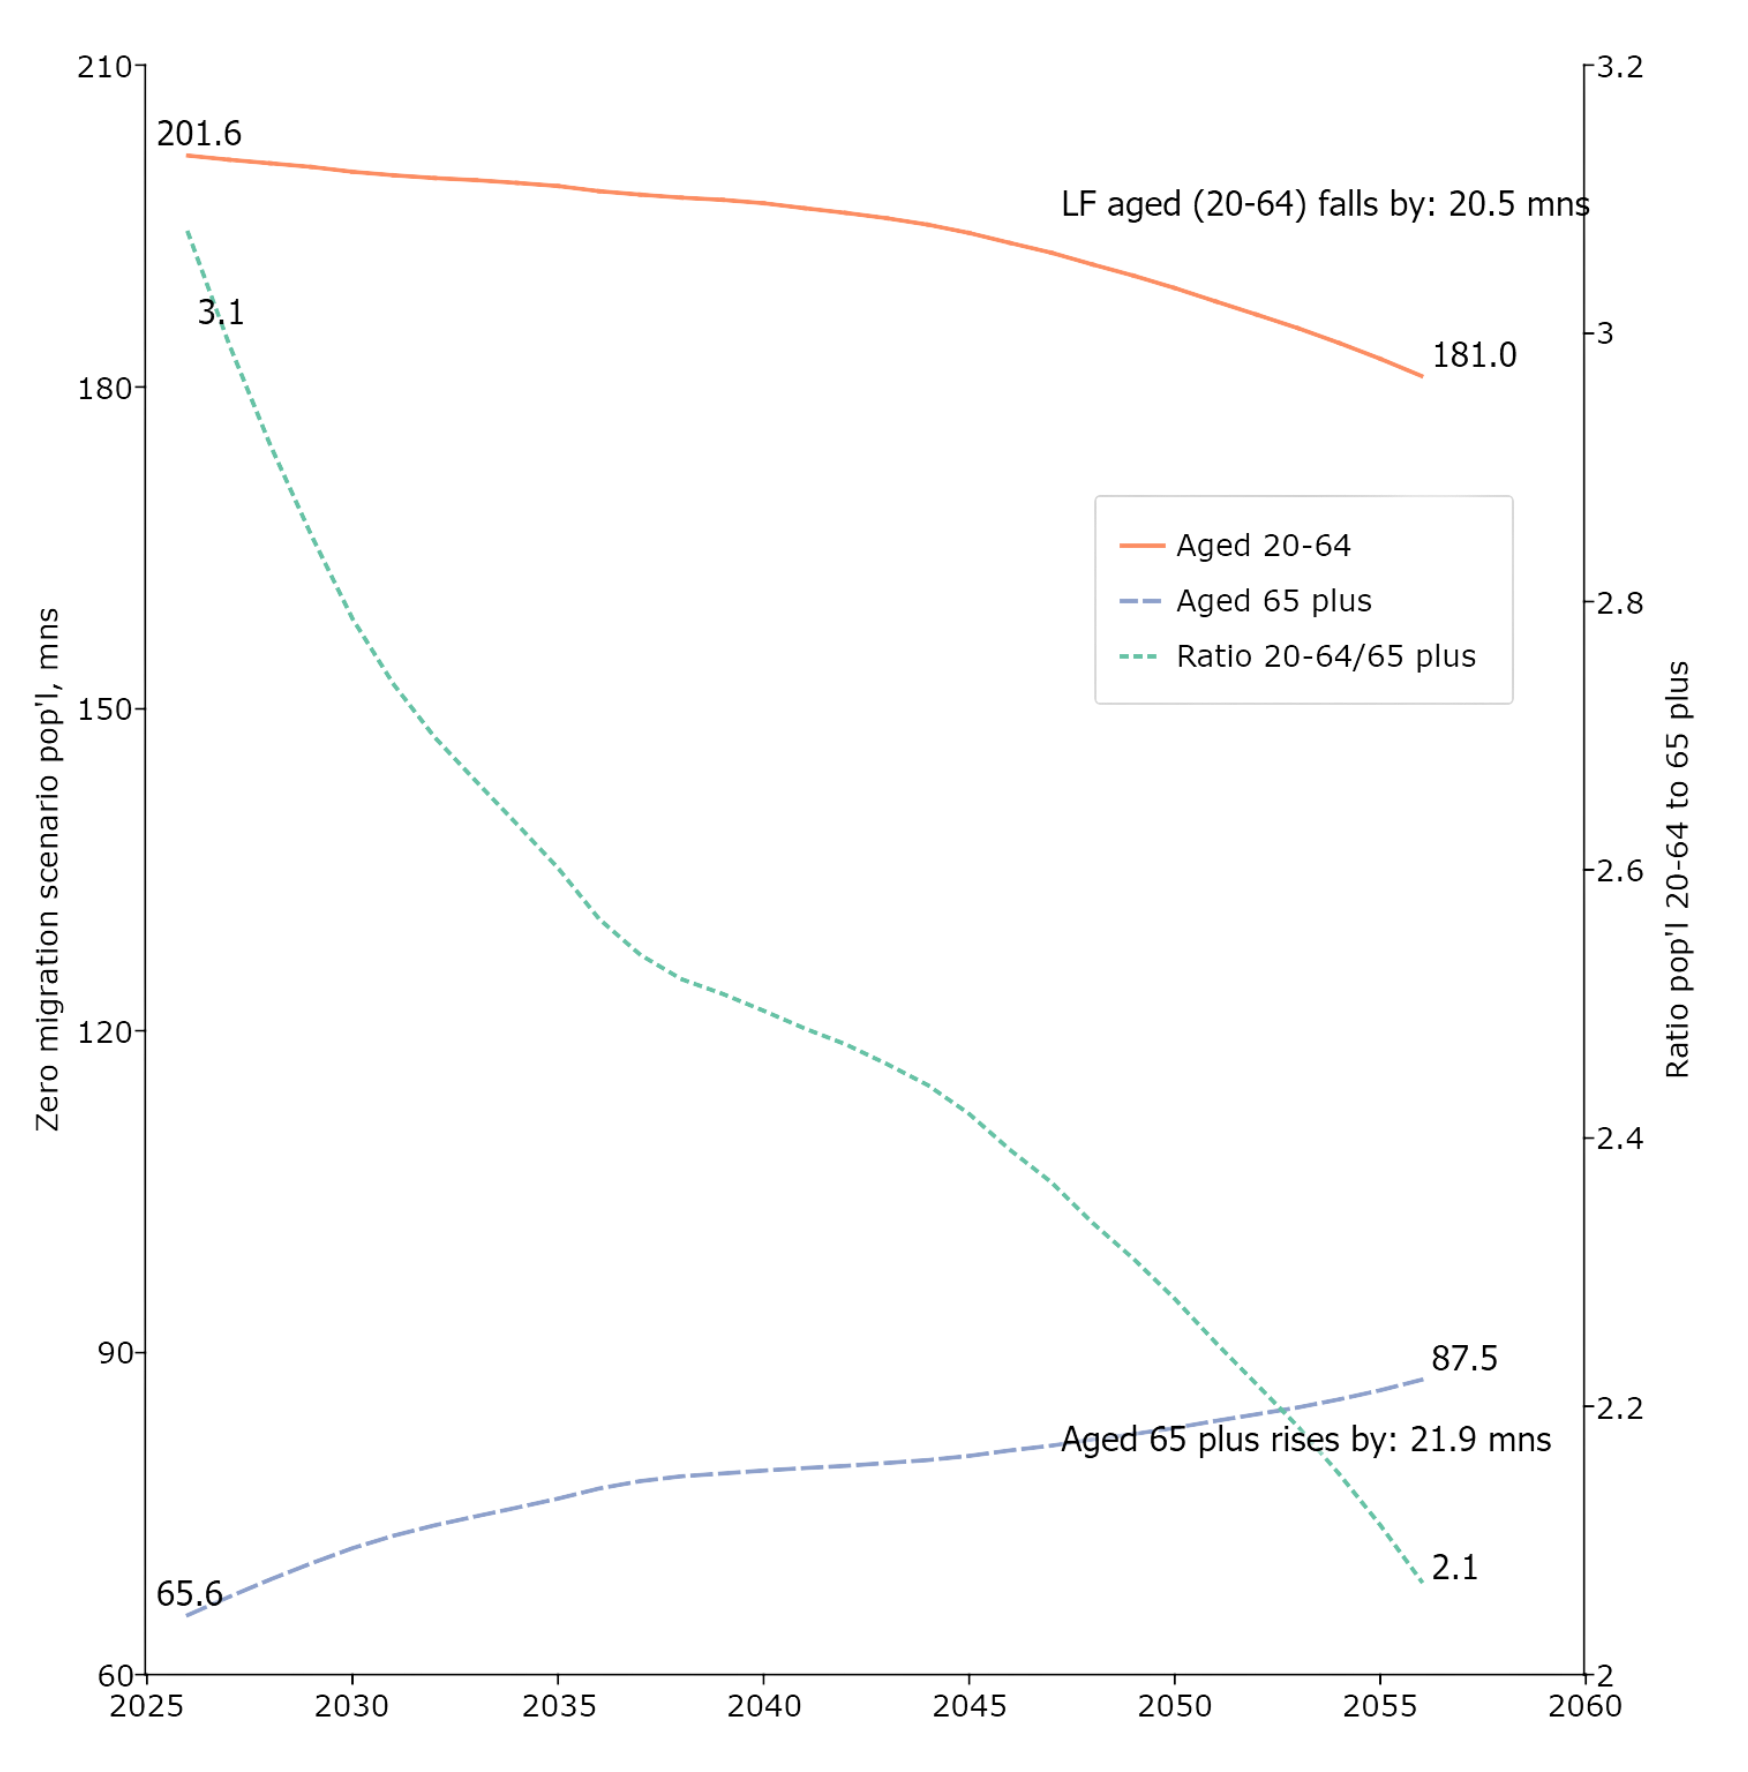
Source: My calculations with data from the downloadable CBO data.
Between 2026 and 2056 the adult population of the USA actually rises a bit (the total population falls as, like the labor force aged, the young population falls substantially) but only because the rise in the 65 plus population offsets the fall in the labor force aged.
“Locked In”: Why Births Today Won’t Save Us
While there is a lot of debate currently about what, if anything, can be done to raise the number of births (Kearney and Levine 2022, 2025, Geruso and Spears 2026, Gauthier and Gietel-Basten 2025, Doepke et al 2023), over these horizons of a few decades the demographic is nearly all “locked in” (Goldstone). Even if births began to rise tomorrow, and rose steadily and substantially, this was no impact on the number of labor force aged 10 or 20 years from now as it just always takes a year for a person to be a year older and barely make a dent even by 2056.
While the decline in the total labor force aged is gradual and the slope seems modest. it is important. One, this is a qualitatively different demographic future than the USA’s past where “rates of natural increase” (births less deaths) led to a growing labor force. Two, from 2026 to 2036 the zero-migration scenario labor force aged declines by 3.32 million people, which is only cumulatively about 1.5 percent. But the population of Pittsburgh (not SMSA, just city) in 2024 was 307,000 and Cincinnati’s population was 315,000. So every year the USA loses a Pittsburgh or Cincinnati in the labor force aged. Three, even the gradual losses cumulate. The cumulative decline by 2056 is 20.5 million which is the combined population of the Metro areas (Standard Metropolitan Statistical Areas, not just city limits) populations of: Orlando, Charlotte, Baltimore, St. Louis, San Antonio, Oakland, and Miami).
But again, the demographic challenge is not so much the absolute decline in labor force aged but the combination of that decline with a larger increase in the population over 65. This matters fiscally as substantial parts of US budget are labor tax financed programs for those over 65 (Social Security and Medicare) – hence the interest of the CBO in long-run demographic projections. If we call the ratio of 20-64 to 65 plus the “support ratio” this falls from 3.1 in 2026 (and the fiscal squeeze is already felt) to only 2.1 in 2056. At current labor force participation rates this would imply well less than two people in the labor force for every person over 65.
The Gap That Needs Filling
Starting from the zero migration scenario we can ask “how many additional labor force aged people would be required to keep the support ratio at its current value of 3.07?” The results are shown in Table 1 for 2036 and 2056. This is where the numbers get eye-popping. Between 2026 and 2036 Labor force aged (20-64) population only falls by 3.32 million. But the 65 plus population grew by 11.8 million. To keep the support ratio constant at its 2026 value of 3.07 that means the USA would need 36.25 more people of labor force age. Otherwise, in just 10 years the support ratio would fall from 3.07 to 2.56. That means the “labor force aged gap for a constant support ratio” is 39.6 million people even after only 10 years of zero migration.
And by 2056 these numbers are very large. The labor force gap is 87.9 million people. There are 21.9 million more old which is a 2026 support ratio constant need for 67.4 million more labor force aged but the demography with zero migration produces 20.5 million less labor force aged.
Table 1: Additional population of labor force aged to keep the support ratio (labor force aged to 65 plus) constant at its 2026 value relative to a zero migration scenario
| Year | Total additional labor force aged needed (mns) (col IV less II) |
Decline in labor force aged relative to 2026 (mns) | Increase in 65 plus population relative to 2026 (mns) | Additional LF aged needed to keep support ratio at 2026 level (mns) | Ratio in zero migration scenario |
|---|---|---|---|---|---|
| I | II | III | IV | V | |
| 2026 | 0.00 | 0.00 | 0.00 | 0.00 | 3.07 |
| 2036 | 39.57 | −3.32 | 11.79 | 36.25 | 2.56 |
| 2056 | 87.94 | −20.54 | 21.92 | 67.40 | 2.07 |
Source: My calculations with CBO data.
In this particular blog I am just laying out the implications of existing demographic projections, not carrying out an analysis nor making “recommendations.” The facts are that the absence of some terrible catastrophe there will be many more people over 65 in the future. And there will be many fewer younger people, including many fewer people in the traditional ages for high labor force participation. This will have many consequences for the economy and the fiscal balances of the federal government and policy will have to adjust to these demographic shifts in ways that are going to be political painful (raising taxes on the few number of workers would be painful, lowering pension or health benefits of the older population would be painful). One margin of adjustment is creating more legal modalities for labor mobility.
This blog was originally published on Substack.
