OECD countries are rapidly aging – their working age populations are shrinking, while their elderly populations are growing. This has significant fiscal and economic implications for these societies, yet thus far there has been no serious policy response. In this blog, Lant Pritchett explores these historically unprecedented and largely ignored trends.
Yogi Berra famously said: “It is tough to make predictions, especially about the future.”
However, there is one set of predictions about the future of the world’s advanced economies that are almost certainly right, are historically unprecedented, have dramatic implications, and yet are mostly ignored. These are the demographic forecasts in the UN Population Division’s 2019 World Population Prospects.
The UN’s seven (sub) regions of advanced economies: North America, Australia and New Zealand, Europe (with four regions: East, West, North and South) and Japan are headed into a historically unprecedented demographic transition into much, much older populations.
As fertility in these regions had dropped below replacement population growth has slowed. But the overall growth of the population is not the main economic issue: it is the change in the age composition of the population. Over the next decades the number of people who are old will continue to grow and the number of people who are young and of “labor force” aged will shrink. Hence the ratios of prime labor force aged (25 to 64) to “retirement” aged (65 plus) populations will fall to numbers never before observed.
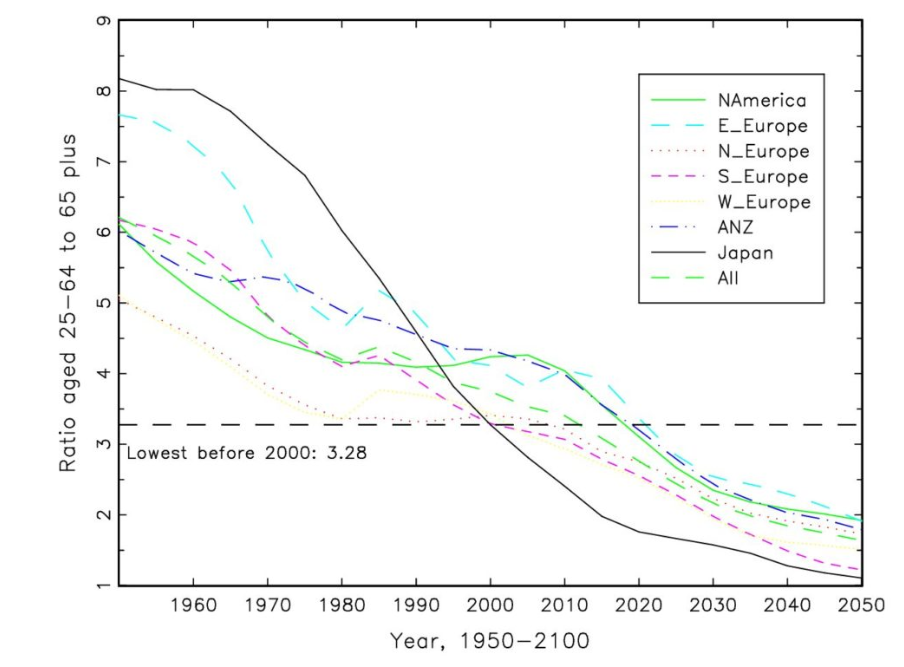
Figure 1 shows for these seven regions the evolution of the ratio of prime labor force aged (PLFA) to retirement aged (RA) population using actual estimates from 1950 to 2020 and the UN Zero Migration (ZM) scenario for predictions from 2020 to 2050 (the two are the same for 2020). The Zero Migration scenario illustrates most clearly the demographic implications of lower fertility and extended longevity.
Figure 1: Ratios of prime labor force aged (25-64) to retirement aged populations (65 plus) without migration are forecast to fall to historically unprecedented levels in every advanced economy region

The lowest PLFA/RA ratio in 1950 was 5. Before 2000 the lowest of any region in the world was 3.28 (roughly the same ratio in 2000 for North, West, and South Europe and Japan). In 2020 this ratio is lower in every one of these regions than it was in any region in the world in 2000.
The aggregate “advanced region” ratio in 2020 (2.76) is less than half what it was in 1960 (5.66).
In 2015 Japan’s ratio fell below 2, less than two people of prime work force age for every retirement aged person. In the Zero Migration scenario every advanced economy region is forecast to be below 2 by 2050.
It is far from obvious that these ratios of work force to aged population can sustain the existing schemes of public and private pensions and social security for the aged and the implied health expenditures. All of these schemes rose to maturity in a historical era in which “pay as you ago” support for these schemes was based on favorable demographics of large ratios of workers to retirees and growing populations (and growing numbers in formal sector employment and rising wages of the employed).
Over the next few decades the aged population continues to growth whereas the growth of the younger population turns sharply negative.
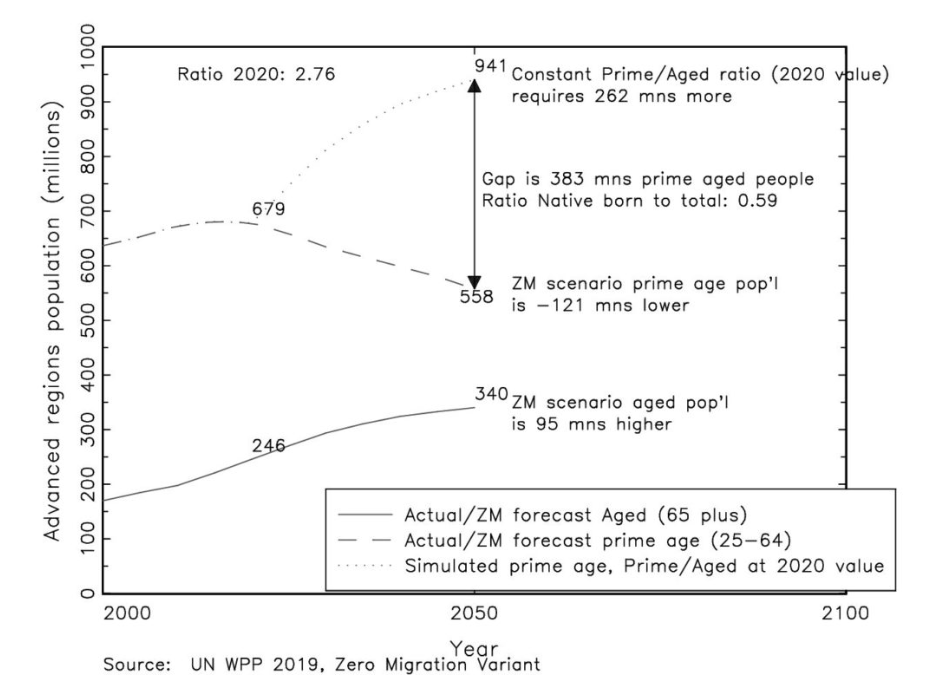
Figure 2 illustrates the evolution of PLFA and RA aged populations separately. In the UN WPP Zero Migration scenario the 65 plus population is forecast to grow by 95 million from 2020 to 2050, from 246 million to 340 million (annual rate of growth of 1.09%). In contrast, the 25-64 aged population is forecast to fall by 121 million people (a negative annual growth rate of 0.65%). So, while the average population falls by only .25 percent a year, a phenomenon that might seem small and ignorable and not a crisis or cause for action, the growth differential between the aged and younger populations is massive, leading to the very large changes in the ratios.
Figure 2: Way more old and way fewer work force aged leaves a massive gap in the workforce aged population needed to keep work force aged to retirement aged ratios constant

With these raw forecasts I do a very simple counter-factual calculation. Suppose one wanted to keep the ratio of prime work force aged population to retiree aged population as its current ratio of 2.76. What would the population aged 25 to 64 have to be to keep that ratio constant? That is simple arithmetic as each older person would need 2.76 PLFA people so there would need to be 262 million (=95*2.76) more PLFA people in 2050 than in 2020.
But, given the demographics without migration, there are not going to be more labor force aged people, there are going to be massively less PLFA people—121 million less.
So the “stable ratio (PLFA/RA)” population of these advanced regions would have to be 941 million whereas on demographics alone there are going to be 558 million. The gap is 383 million people.
There are three ways in which 383 million is a massive number.
First, the entire 2020 population of North America (USA plus Canada) is 368 million and the entire population of West and North Europe is 302 million. So the “prime aged population gap” of the advanced regions is equal to the total (all ages) populations of huge advanced regions like North America or the EU.
Second, and this is adding a hypothetical to a counter-factual, suppose that gap were filled by migration. This would imply that 40 percent of the total PLFA population (=383/941) would be the result of migration.
Third, according to the UN estimates of the stocks of migrants by destination and origin in 2017 there were only 119 million migrants from “less developed” countries in “more developed” countries. This means that if the gap were to be made up by migrants from “less developed” regions (and of course since each of the advanced regions are losing labor force aged populations movement among them cannot change the overall ratios) this would imply the stock of migrants in more developed from less developed countries would have to triple over the next 30 years.
Let me conclude with the four points from the opening paragraph.
One, while lots of things about the future are hard to predict the demographics of the next few decades isn’t one of them. Everyone who is going to be 65 in 2050 is already alive and 35 years old today so they are neither counter-factual or hypothetical people, the only question is predicting their survival and the actuarial tables have been quite stable and predictable. So, compared to predicting political (who saw the collapse of the Soviet Union?) or economic (who saw the timing or magnitude 2008 financial crisis?) or social trends (who saw gay marriage coming so quickly in the USA?), demography is very predictable.
Two, these trends are historically unprecedented. Humankind has never seen entire national and regional populations choose fertility rates so low the demographic pyramid inverts (more old than young) and total populations fall so dramatically for such extended periods. The advanced economies of the world are moving into completely uncharted demographic territory.
Three, the implications of these demographic trends are likely to be dramatic (although the implications are hard to predict because these conditions have never existed before) for the economy, for fiscal balances, for politics, for society at large.
Four, so far, these coming demographic changes are largely ignored. As everyone has parents and grandparents and everyone themselves ages (at the same rate in fact, one year per year) the importance for the typical individual in these advanced economies lives of these demographic shifts is likely larger than any of the other issues about the foreseeable future that do chew up column inches, articles, international conferences, and media attention. My daughter is 35 years old and very concerned about how climate change will affect her child. I think what demography implies for her (and her cohort) when she is 65 in 2050 is at least as pressing an issue but has no traction at all.
